| SMOS-Box Tools |
|
Readers not familiar with the SMOS-Box software might read the Introduction to the SMOS-Box and the explanation of the representation of SMOS Data in SNAP first.
Version 5.4.0 of the SMOS-Box is comprised of four tools:  the grid point data table,
  the grid point flag matrix diagram,
  the grid point brightness temperature chart, and
  the snapshot information tool. The tools can be invoked by
clicking on the corresponding icons arranged in the SMOS-Box
toolbar shown below.
the snapshot information tool. The tools can be invoked by
clicking on the corresponding icons arranged in the SMOS-Box
toolbar shown below.
By default the SMOS-Box toolbar is located next to the standard SNAP toolbar.
When a SMOS product is opened in SNAP, the list of available band data is displayed in the Products View. Double-clicking onto a band name opens a window displaying the band data as an image (see the screenshots below). Due to the SNAP data model used internally to represent all EO data products, it is required to resample SMOS L1C and L2 gridded data to rectangular raster data. The images created from SMOS products in SNAP thus use the Geographic WGS-84 coordinate reference system.
The geo-coding of all SMOS data products is provided by the same WGS-84 geographic coordinate reference system. The mapping between image pixels and SMOS grid points is established by a lookup table being a raster dataset of 16384 by 8192 image pixels, yielding about 30 image pixels for an equatorial grid cell of the ISEA4H-R9 grid.
For SMOS L1c Science products the image displayed by default when double-clicking on a band is computed on-the-fly. Actually, the image is computed from the snapshot data in the same manner as a Browse product is computed from the corresponding Science product.
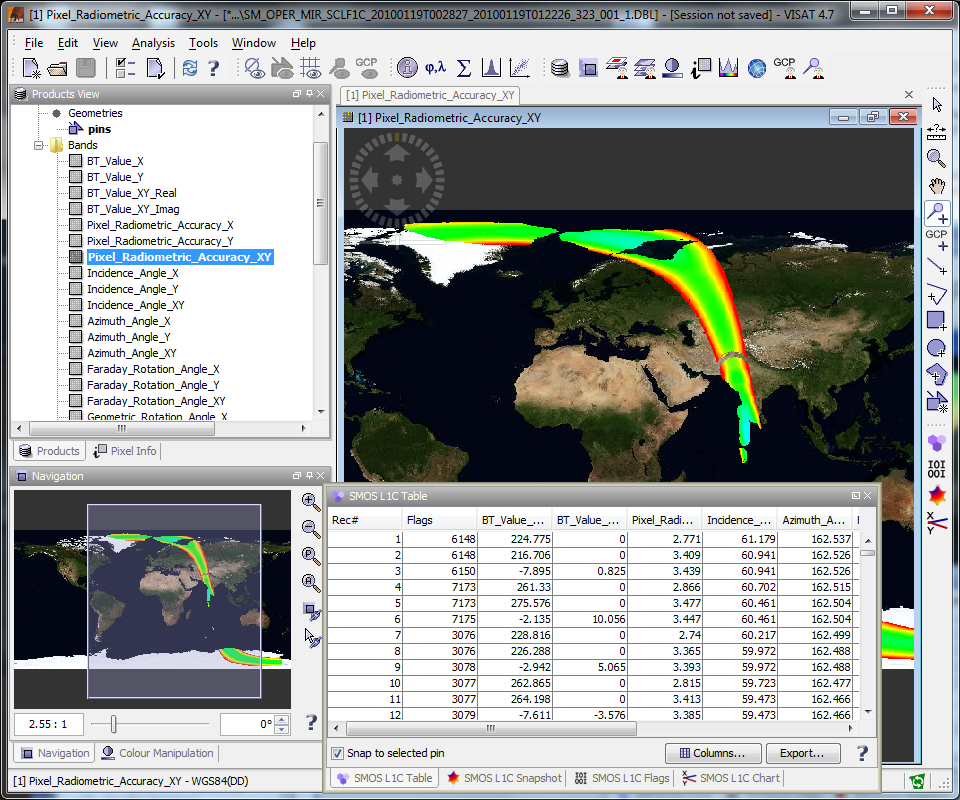
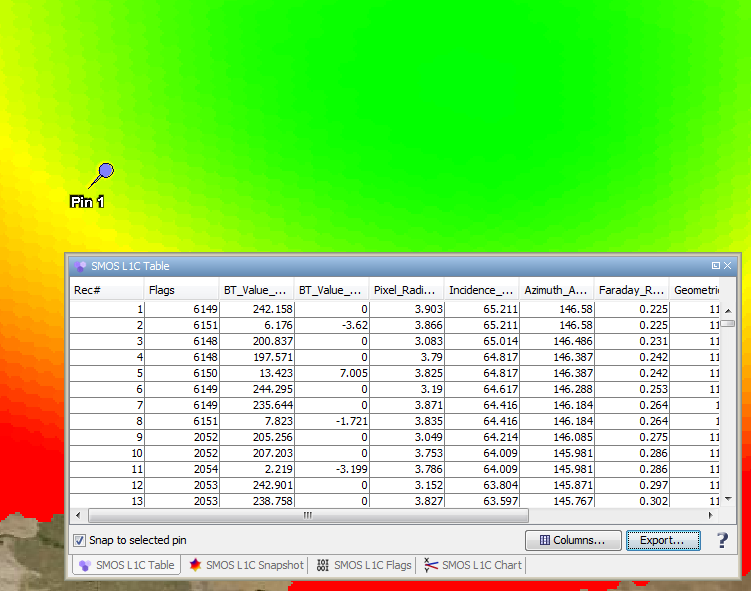
Using the grid point data tableThe grid point data table tool can be invoked by clicking on the
icon in the SMOS-Box toolbar. The table shows all measurements
made for the currently selected grid point, with a single
measurement record per row. By default the selected grid point is
defined by the position of the mouse pointer. By activating the
Snap to selected pin option the selected grid
point may also be defined by the position of a currently selected
pin.
The measurements displayed in the table columns can be explicitly chosen by clicking on the Columns... button, which pops up a dialog for selecting or deselecting individual measurements. The whole table can be exported to character-separated text, either stored in a file or the clipboard.
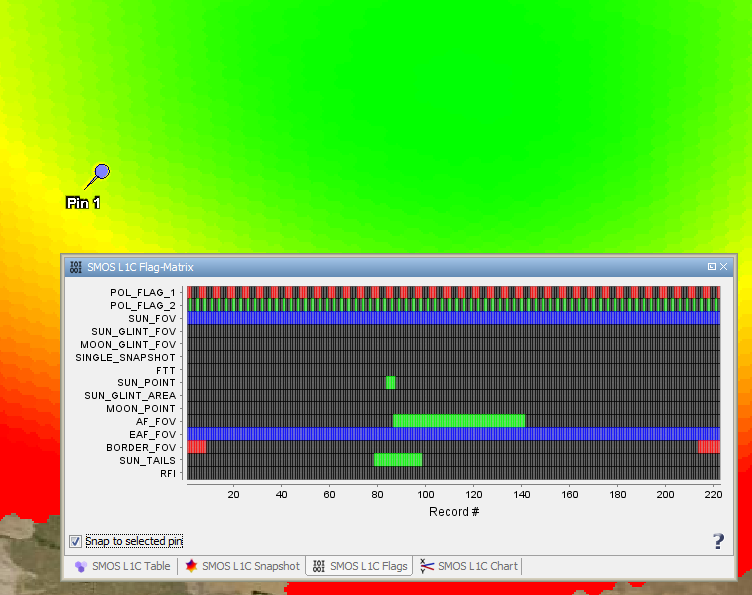
Using the grid point flag matrixThe grid point flag matrix tool can be invoked by clicking on
the
icon in the SMOS-Box toolbar. The flag matrix shows all flags
associated with measurement records acquired for the currently
selected grid point, with a single measurement record per column
and a single flag per row. A raised flag is indicated by a coloured
entry in the flag matrix. By default the selected grid point is
defined by the position of the mouse pointer. By activating the
Snap to selected pin option the selected grid
point may also be defined by the position of a currently selected
pin.
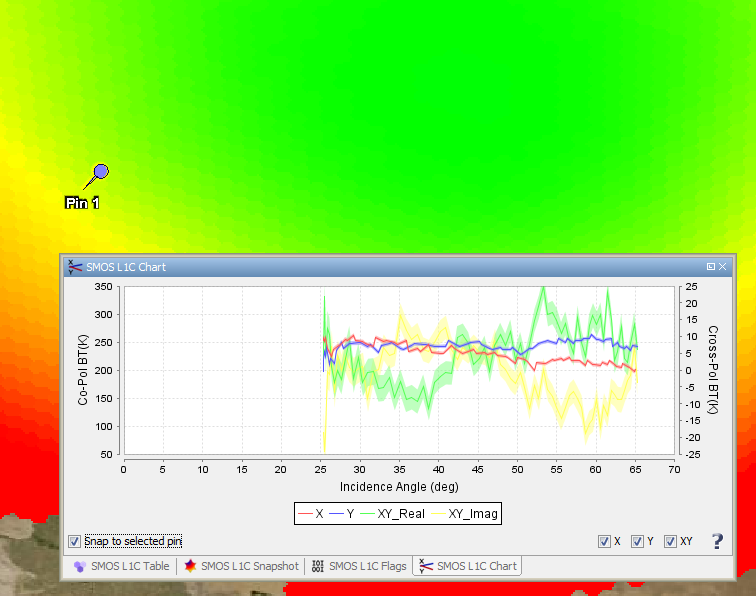
Using the grid point brightness temperature chartThe grid point brightness temperature chart tool can be invoked
by clicking on the
icon in the SMOS-Box toolbar. The brightness temperature chart
shows a diagram of the brightness temperatures measured for the
currently selected grid point. A single series of brightness
temperatures versus incidence angle is shown for each polarisation
mode. By default the selected grid point is defined by the position
of the mouse pointer. By activating the Snap to selected
pin option the selected grid point may also be defined by
the position of a currently selected pin.
For the brightness temperature measurements made in the X and Y copolarisation modes the uncertainties are shown as error bars. The display of individual polarisation modes can be switched on and off by activating or deactivating the corresponding checkboxes.
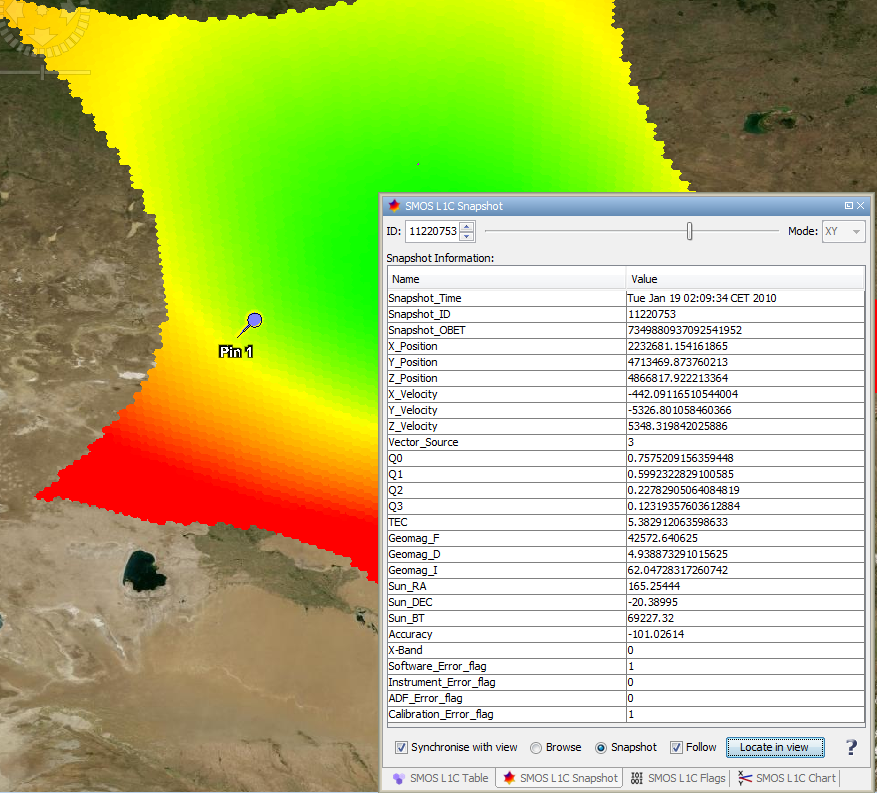
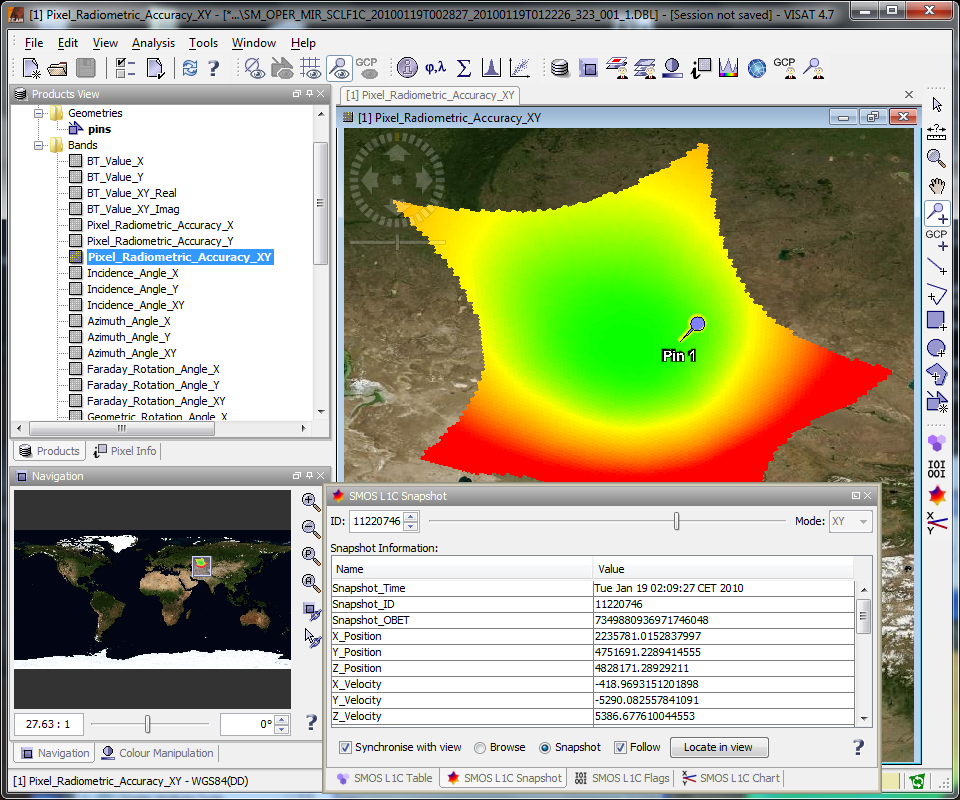
Using the snapshot information toolThe snapshot information tool can be invoked by clicking on the
icon in the SMOS-Box toolbar. The tool can be used for browsing
the 'Swath Snapshot List' contained in the SMOS L1c Science
products, and for selecting and displaying images of individual
snapshots. The components of the snapshot information tool are
described below.
Note: If the snapshot information tool is used for selecting and displaying snapshot images, all image analysis and statistics tools always apply to the selected snapshots.
For selecting an individual snapshot the tool provides a spinner which allows to manually specify a certain snapshot ID and to navigate forward and backward in the list of snapshot IDs.
The slider provides an explicit mechanism for fast navigation through the list of snapshot IDs.
The combobox provides a facility for selecting a certain polarisation mode (any, X, Y, XY). When a certain mode is selected, only IDs of snapshots acquired at the selected mode are navigable (i.e. IDs of snapshots acquired at a different mode do not appear in the list of snapshot IDs) by the spinner and slider components.
While navigating through the snapshots, the corresponding 'Snapshot Information' like TEC and geomagnetic field, etc. are displayed in a table.
Enabled only when there is an active image view. Synchronising implies:
Changing the active image view while being in synchronised mode implies:
There are two radio buttons for selection the data source for the active image view. Selecting the 'Snapshot' radio button implies that, firstly, the active image view displays the data of the selected snapshot instead of the browse, and, secondly, the selected snapshot becomes the data source for all bands in the selected product, unless the proper polarisation mode is not available for the selected snapshot. In the latter case, the nearest snapshot acquired in the proper polarisation mode becomes the data source.
Selecting the 'Browse' radio button implies that, firstly, the active image view shows the raster data of the browse instead of the selected snapshot, and, secondly, the data source for all bands in the selected product is reset to the browse.
When checked the viewport of the active image view automatically moves to and zooms into the region covered by the selected snapshot.
When pressed the viewport of the active image view moves to and zooms into the region covered by the selected snapshot.