
| DAS-Tool Semantic Annotation | |
Semantic annotation is a sub-system of the DAS-Tool plugin,
focusing on the identification of relevant scene characteristics
and further grouping (based on a specific criteria) by means of
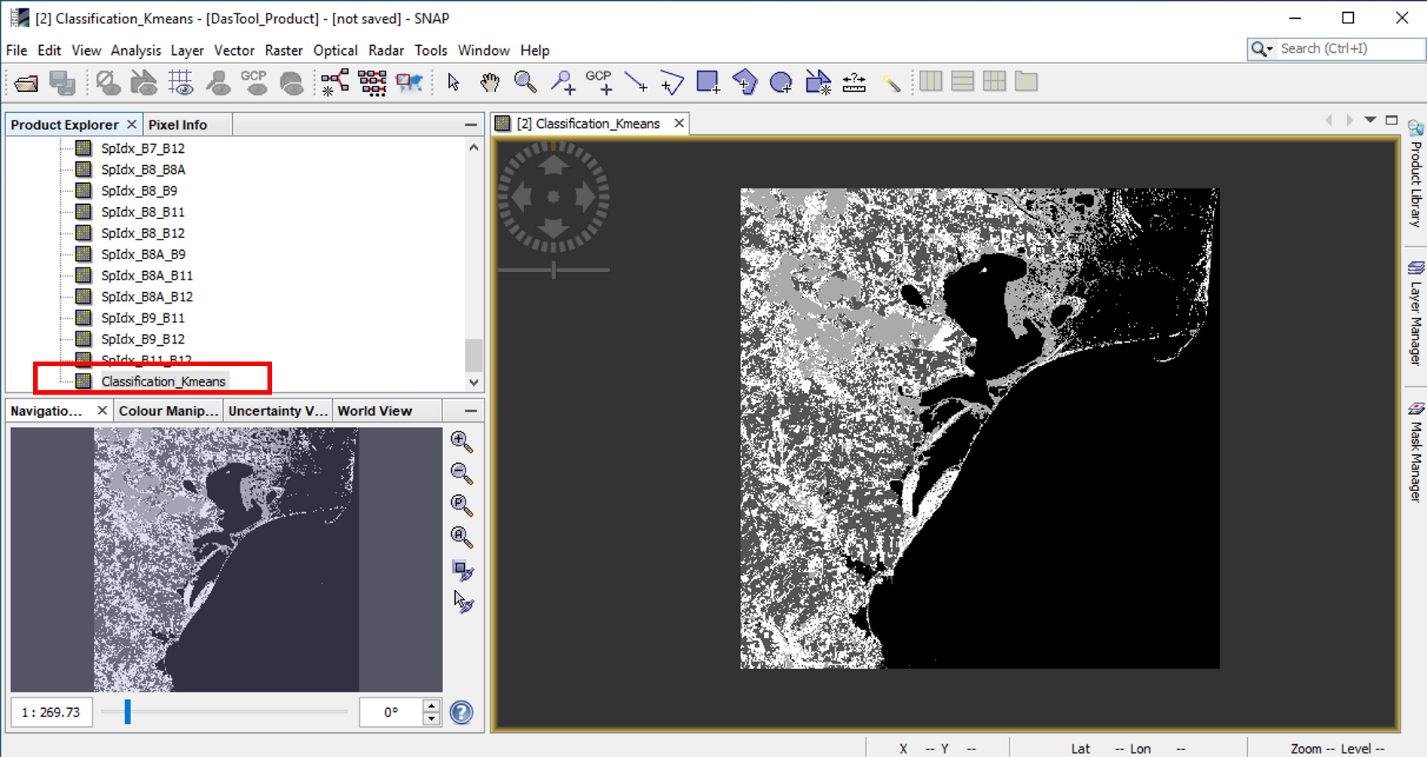
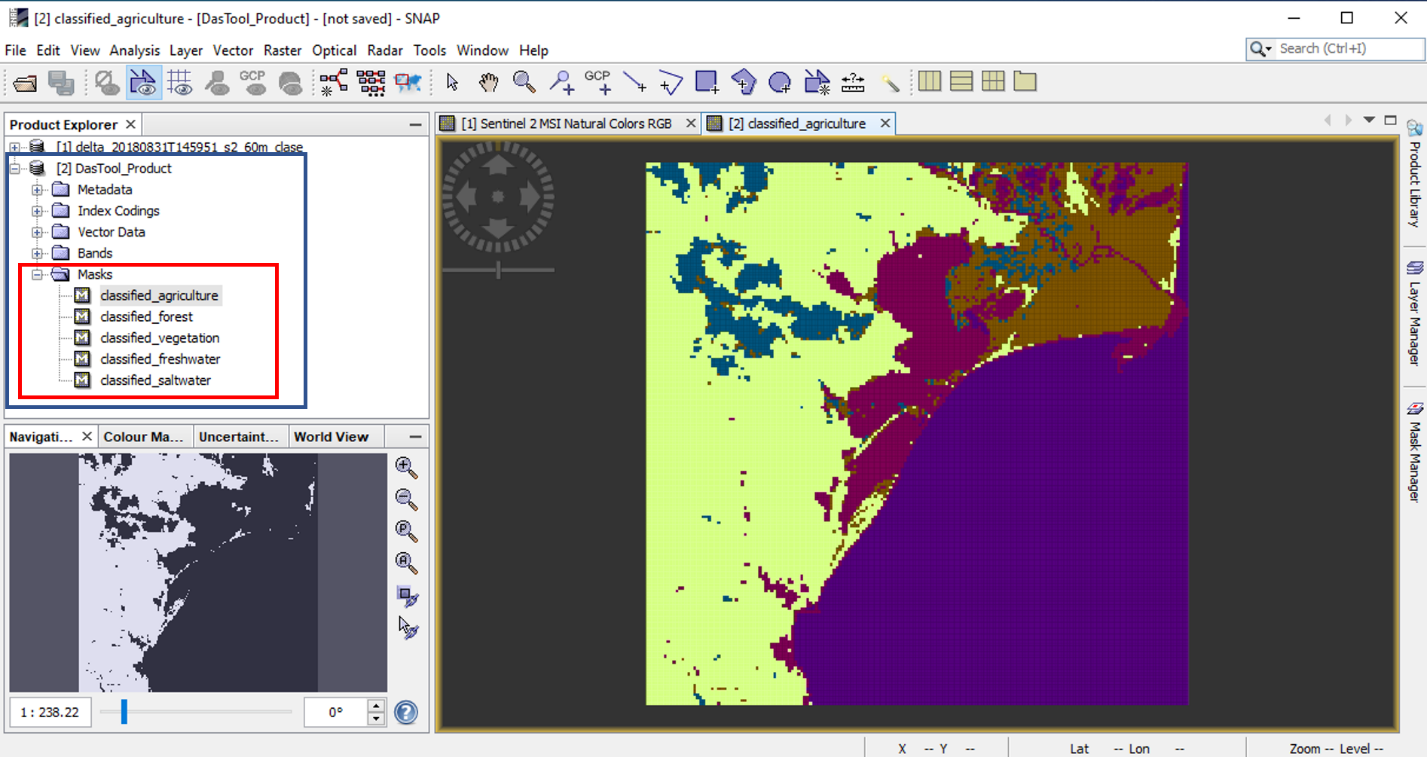
classification methods. This step will result in a classification
map emphasizing the existing categories of objects inside the
scene. This procedure entails a compact workflow interconnecting
feature extraction and feature classification in such a way to best
describe the Sentinel 2 data content characteristics [1].
The analysis can be performed at pixel or patch level.
The workflow of the pixel level analysis is presented below:
At pixel level, the analysis can be made using any combinations of the following feature extraction and classifications techniques.
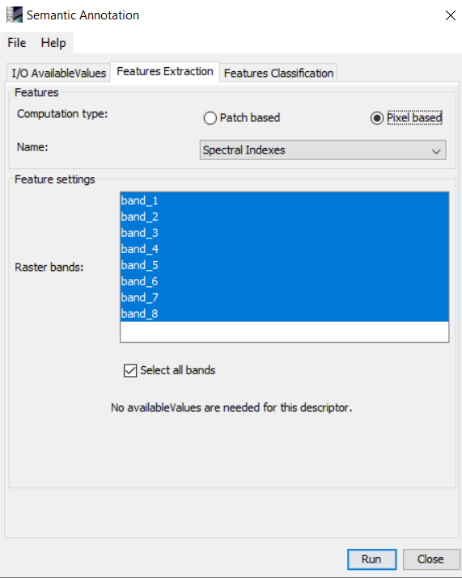
Spectral indexes. The spectral indexes are referring to the combinations of surface reflectance from multiple spectral bands to highlight a specific feature that indicates the presence of vegetation, water, mud, ice, geologic coverage, etc. The indexes computed by the DAS - Tool module are the ones presented in [8].
Polar coordinates. To compute the polar coordinates features of a multispectral image, the radiances values of each spectral band is converted into polar coordinates and the image is characterized through a distance ρ and N-1 angles θ, where N represents the number of the spectral bands present in the multispectral image [2].
| Range of values | 2^2 - 2^16 |
| Default values | 32 |
| Range of values | 2^5 - 2^9 |
| Default values | 256 |
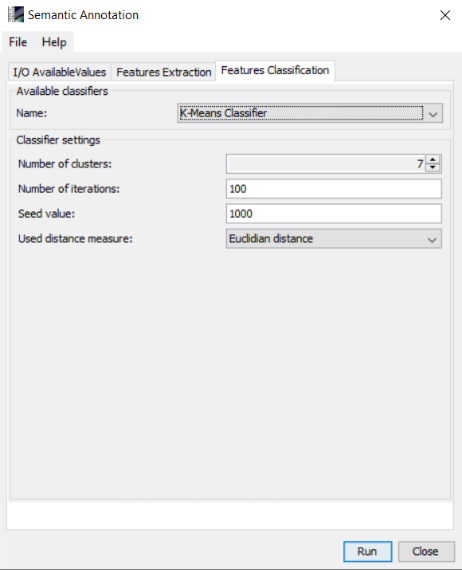
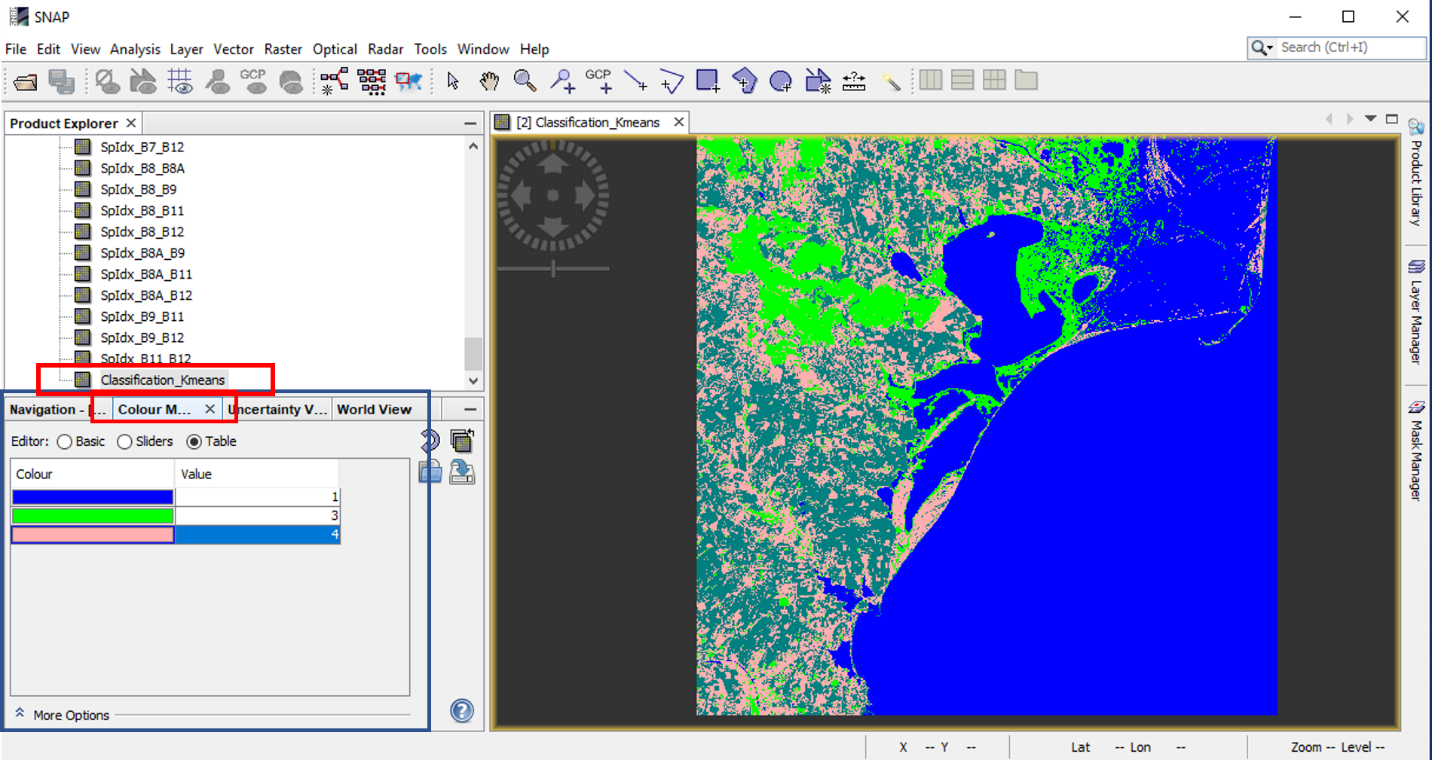
K-means Classifier. The k-means classifier is an unsupervised learning algorithm which groups the data points into homogeneous subsets. After the user indicates the desired number of subsets, the algorithm's goal is to identify the subsets' centroids that minimizes the distance between same class points.
| Range of values | 3-10 |
| Default values | 7 |
| Range of values | 1-100 |
| Default values | 100 |
| Range of values | - |
| Default values | 1000 |
| Range of values | Canberra, Chebyshev, Earth movers, Euclidean, Manhattan |
| Default values | Euclidean |
Latent Dirichlet Allocation. The Latent Dirichlet Allocation
(LDA) approach proposed for DAS-Tool includes the use of k-means
algorithms together with the LDA modelling. At first, k-means will
be applied directly on the image to perform a rough grouping of
pixels (based on high similarity, we release the threshold to
ensure convergence) and define the visual words. The second step
refers to the application of a Latent Dirichlet Allocation (LDA)
model capable of discovering classes with semantic meaning based on
the latent information hidden in the scene [6]. LDA is basically a
three-level hierarchical Bayesian model for text analysis, formed
by words, documents, and corpus. The model assumes that the order
of words inside the document and the order of documents inside the
corpus are ignored. In addition, each document is defined as a
finite random mixture of latent topics. A topic is characterized by
a probability distribution over a set of words in the
vocabulary.
| Range of values | 100-300 |
| Default values | 100 |
| Range of values | 3-10 |
| Default values | 5 |
| Range of values | 5-50 |
| Default values | 10 |
| Range of values | 1-10 |
| Default values | 4 |
The workflow of the patch level analysis is presented below:

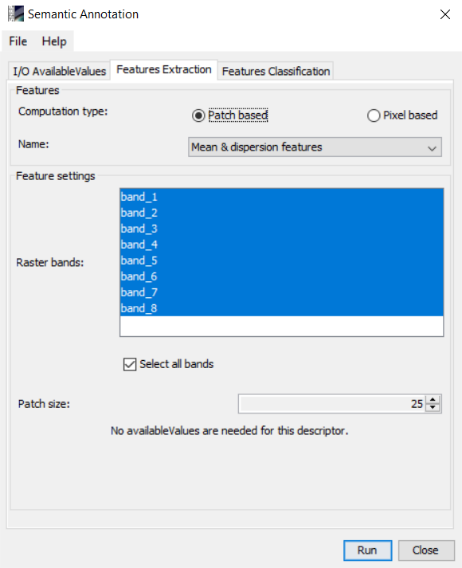
At patch level, the analysis ca be made using any combinations of the following feature extraction and classifications techniques.
Mean and dispersion. Each patch is described by a feature vector consisting of its mean and dispersion on each spectral band.
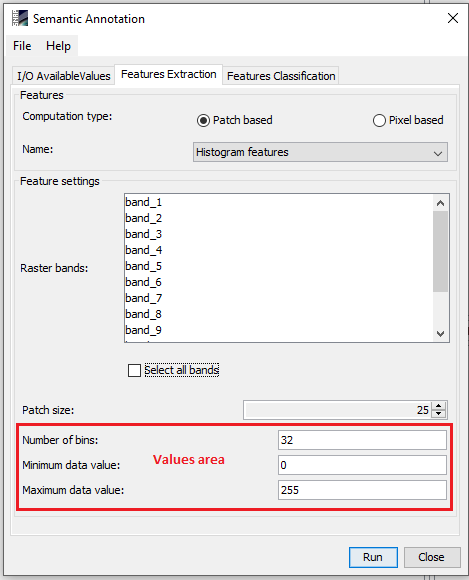
Histogram. The histogram is the colour histogram extended for the high spectral resolution of multispectral images generating the distribution of the spectral values [3].
| Range of values | 2^5 - 2^9 |
| Default values | 32 |
| Range of values | 2^8 - 2^16 |
| Default values | 0 |
| Range of values | 2^8 - 2^16 |
| Default values | 255 |
Gabor. The Gabor features are obtained by space-frequency analysis of the texture, using constant bandwidth filters. The features are the result of a multi-resolution analysis and their vectors consist of the first and second order moments of the Gabor [4].
| Range of values | - |
| Default values | 6 |
| Range of values | - |
| Default values | 4 |
BoW. The Bag of Words framework computes local features for each
patch, then a k-words dictionary is formed collecting k randomly
selected local features. Finally, each patch is represented by a
k-dimensional descriptor with only one non-zero element, the one
related to its closest word.
The BoW - Spectral indexes the features are computed on the image
represented by its spectral indices.
| Range of values | 100 - 300 |
| Default values | 100 |
| Range of values | Random samples |
| Default values | Random samples |
| Range of values | 2^2 - 2^16 |
| Default values | 256 |
| Range of values | 100-300 |
| Default values | 100 |
| Range of values | Random samples |
| Default values | Random samples |
K-means Classifier - as presented in the pixel level subsection.
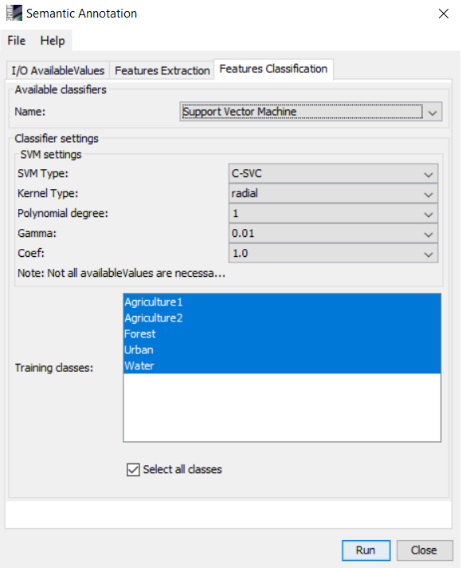
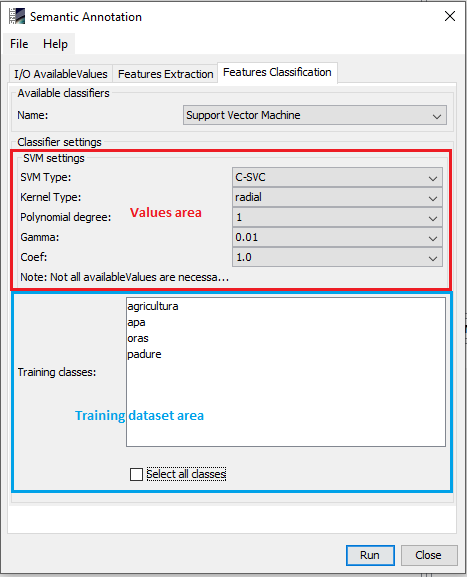
Support Vector Machine. Support vector machines (SVM) is a supervised learning method, becoming a reference algorithm to solve classification problems due to its flexibility and computational efficiency of handling multidimensional data. The SVM implementation used by the DAS-Tool module is LIBSVM [https://www.csie.ntu.edu.tw/~cjlin/libsvm/].
| Range of values | C-SVC, nu-SVC, epsilon - SVR, nu-SVR, one-class SVM |
| Default values | C-SVC |
| Range of values | Linear, polynomial, radial, sigmoid |
| Default values | radial |
| Range of values | 1-10 |
| Default values | 1 |
| Range of values | 10^(-4) - 10^(4) |
| Default values | 0.01 |
| Range of values | 10^(-4) - 10^(4) |
| Default values | 1 |
K-Nearest Neighbour. The k-Nearest Neighbour Classifier (kNN) is a supervised learning method that computes the distance between the unclassified points to all the labelled training data. Further, based on the metric used to measure the distance, the algorithm generates a set consisting of the k-nearest neighbours to the unclassified point. Finally, the most representative class for the chosen neighbours is assigned to the new data [7].
| Range of values | 3 - 100 |
| Default values | 6 |
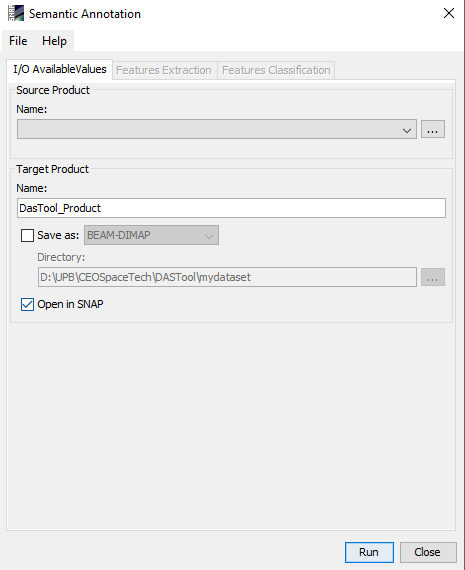
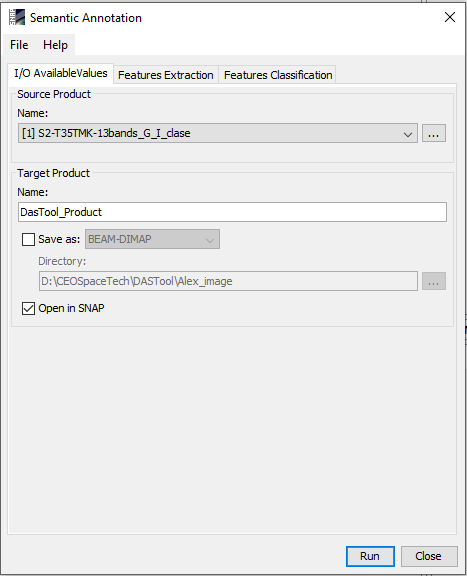
The Semantic annotation tool can be invoked from the Optical menu, select DAS-Tool -> Semantic Annotation
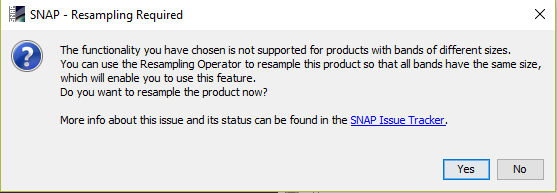
If the product's bands have the same sizes, selecting the Semantic Annotation command, a dialog box with three tabs will be opened, otherwise the following warning message will appear
I/O Available Values tab allows user to select the product to be analysed and what will happen to the result.
Feature Extraction tab tab allows user to select the analysis level (patch/pixel), features used to describe the image characteristics and the required parameters.
Feature Classification tab allows user to select and set the classifier used to analyse the chosen product.
[1] F.A. Georgescu, C. Vaduva, D. Raducanu and M. Datcu Feature Extraction for Patch-Based Classification of Multispectral Earth Observation Images, in IEEE Geoscience and Remote Sensing Letters, Vol. 13, No. 6, pp. 865-869, 2016.
[2] F.A. Georgescu, D. Raducanu, and M. Datcu New MPEG-7 Scalable Color Descriptor Based on Polar Coordinates for Multispectral Earth Observation Image Analysis, IEEE Geoscience and Remote Sensing Letters14.7 (2017): 987-991.
[3] A.M. Ferman, A.M. Tekalp, and R. Mehrotra Robust color histogram descriptors for video segment retrieval and identification, IEEE Transactions on image processing 11.5 (2002): 497-508.
[4] W. Li, K. Mao, H. Zhang, and T. Chai Designing compact Gabor filter banks for efficient texture feature extraction. In 2010 11th International Conference on Control Automation Robotics & Vision (pp. 1193-1197). IEEE. December 2010
[5] S. Cui, G. Schwarz, and M. Datcu Remote sensing image classification: No features, no clustering, IEEE Journal of Selected Topics in Applied Earth Observations and Remote Sensing 8.11 (2015): 5158-5170.
[6] C. Vaduva, I. Gavat, and M. Datcu Latent Dirichlet allocation for spatial analysis of satellite images, IEEE Transactions on Geoscience and Remote Sensing 51.5 (2013): 2770-2786.
[7] T. Cover, and P. Hart Nearest neighbor pattern classification, IEEE transactions on information theory 13.1 (1967): 21-27.
[8] G.Marchisio, F. Pacifici, and C. Padwick On the relative predictive value of the new spectral bands in the WorldWiew-2 sensor," in Proceedings of IEEE International Geoscience and Remote Sensing Symposyum (IGARSS), Jul. 2010, pp. 2723-2726.