REACTIV Change Detection
This operator implements the "Rapid and EAsy Change
detection in radar TIme-series by Variation coefficient (REACTIV)"
algorithm proposed by Koeniguer et al. in [1].
The REACTIV algorithm filters the speckle noise by exploiting the
time dimension. Therefore the algorithm can not only to improve the
signal-to-noise ratio, but also to detect all the pixels for which
a change occurred between the first and the last observation date.
The REACTIV algorithm is also a visualization tool. It highlights
the detected changes in a stack of SAR images: where are the
changes, when they happened and what their intensities. By
exploiting the HSV display, the algorithm presents all the change
information of the time series in one image. [1]
The HSV space consists of 3 components: the Hue, the Saturation and
the Value (Figure 1).

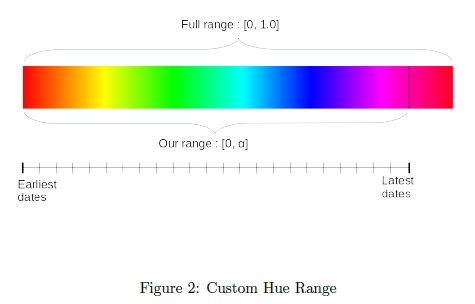
The Hue component encodes the dating information of the event.
Thus, when a change is displayed, we can approximately know when it
occurs in the observed period. In order to avoid the resemblance of
color between the extreme start of the spectrum and its extreme
end, the initial [0, 1] range is reduced to [0, 0.9] range (Figure
2). [1]
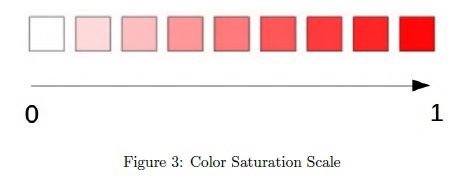
The Saturation component, responsible for how intense the color
picked by the hue value will be, is bound to the change intensity:
the bigger the change, the more saturated the color will appear.
This means that the white spots on the map represents places with
low changes over time (Figure 3). [1]
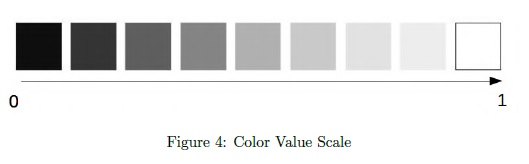
Finally, to keep the usual SAR Image look, the value component
ranging from dark to bright, with respect to the color picked by
the hue value, represents the maximum value of the input signal
over both polarizations (Figure 4). [1]
Input
- The input to this operator could be a coregistered stack of
Sentinel-1 IW dual-pol products.
Output
- The output of the operator is a product with hue, saturation
and value bands.
Parameters Used
The following parameters are used by the
operator:
- Mask threshold: threshold used in creating the change mask.
Pixel with saturation value, which represents the intensity of
change, that is greater than this threshold will be masked as 1,
otherwise 0.
- Include source bands: if the checkbox is selected, all
bands of the source product will be included in the target
product together with the hue, saturation and value bands.
Figure 5.
REACTIV Change Detection dialog box
Reference:
[1] Elise Colin Koeniguer, Alexandre Boulch, Pauline
Trouve-Peloux and Fabrice Janez, “Colored visualization of
multitemporal data for change detection: issues and methods”,
EUSAR, 2018.